
Our Place
An outline of the Bega Valley Shire, our people and our economy.
Welcome to Our Place
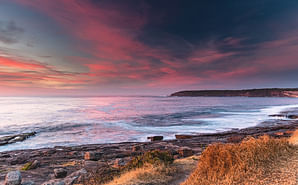
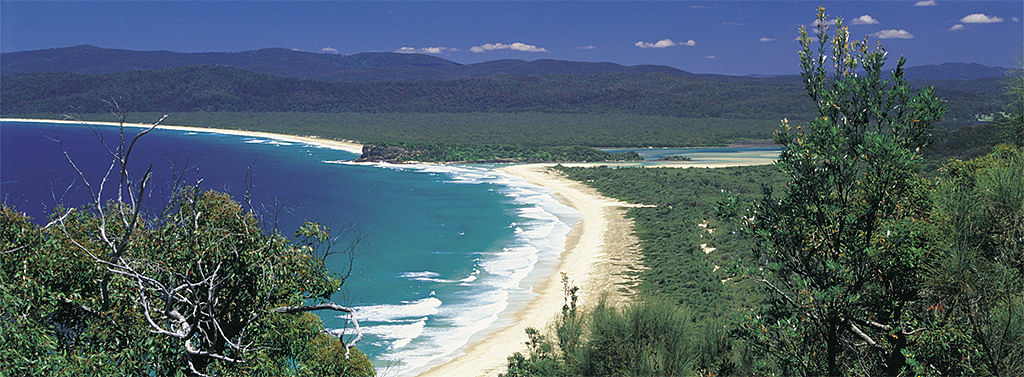
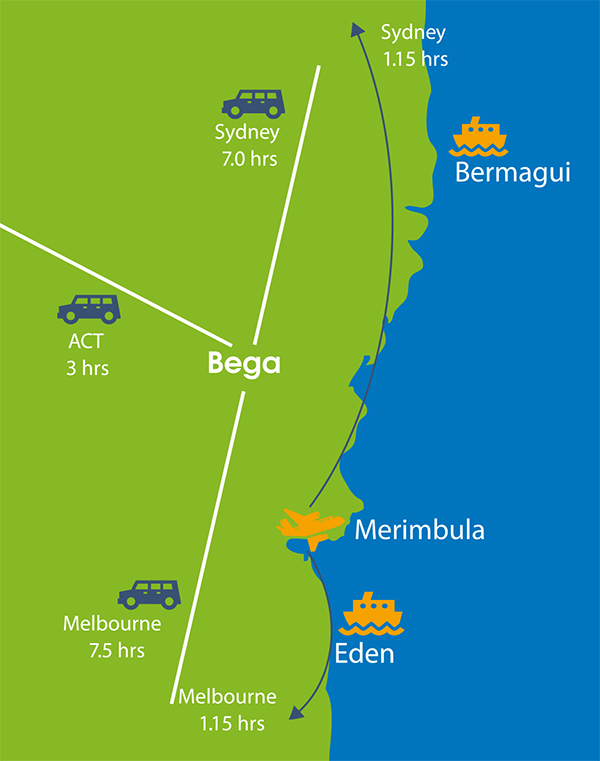
The Bega Valley Shire is located at the south-eastern corner of New South Wales, half-way between Australia’s two largest cities, Sydney and Melbourne and three hours’ drive from the nation’s capital, Canberra. Our coastal fringe extends from Wallaga Lake in the north to Cape Howe and the Victorian border in the south. At over 6,200 km2, the shire is the largest local government area in coastal NSW and collectively this 225-kilometre section forms the beautiful Sapphire Coast, the heart of Australia’s Coastal Wilderness.
Our community vision explains our collective aspiration that by working together, the Bega Valley Shire community integrates quality of life, enterprising businesses, sustainable development, and conservation of the environment.
We are ... Bega Valley
The Yuin people are the traditional custodians of the shire. Ancient stories, ceremonies, special places and sacred objects are embedded in the landscapes, trees, hills and waterways of the shire, and form the basis of traditional lore, custom, spiritual connection and custodial obligations.
The shire’s population of around 36,000 is dispersed, with a third of us living in rural areas and the remaining two thirds spread amongst 12 villages, 4 major towns and adjacent urban settlements. Between 2016 and 2021 our population grew by 1.57% per year, slightly more than the rest of NSW. Our population is predicted to grow over the next 15 years at a slower rate of 0.65% per year. With a median age of 52, our population is older than the rest of NSW (median age 39), but we have high levels of independence, with 47% of us fully owning our own homes, and 22% of us actively volunteering.
Currently fewer of us have bachelor level education than the state average, but more of us are attending university than ever before. Around half of us work, predominantly in agriculture, manufacturing, health and social services, retail and tourism, and a significant proportion of us are retired.
While we enjoy lower rent and mortgage costs than average, our lower than average weekly income means affordability is just as important to us as our city counterparts.
This is ... Bega Valley
Our strengths
- Food product manufacturing
- Agriculture, forestry and fishing
- Tourism
- Healthcare and social assistance
- Natural assets and liveability
- Intellectual and cultural capital
- Attractive retirement destination
- Low cost of housing
- Location
We have a strong economy, with an estimated $1.78 billion annual Gross Regional Product, over $797 million in exports each year and 3,153 local businesses. Our main industries are farming, particularly dairy and the associated cheese manufacturing industry in Bega; construction commercial fishing and aquaculture; health and social services; and tourism. The key industrial precincts are in North Bega, Eden and South Pambula and main retail areas in the town centres of Bega, Eden and Merimbula.
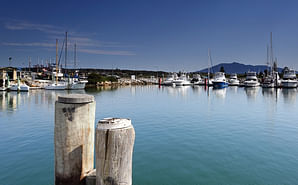
Transport is predominantly by private car with limited bus services. Merimbula Airport provides air transport connectivity to Melbourne and Sydney and the Port of Eden is an important working port able to berth large cruise ships.
We are a regional centre for schools and higher education institutions. There are currently 18 primary and four high schools which include a mixture of private and public. The University of Wollongong operates a campus in Bega. In addition, vocational courses and trade skills are offered by the TAFE Illawarra campus also in Bega.
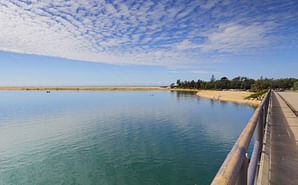
Our long stretches of coastline are a tourism draw card. Merimbula, Eden, Bermagui and Tathra are major tourist centres and typically experience a threefold boost in their populations during the peak summer period. On average, an estimated 1 million visitors come to the Bega Valley each year, spending around $480 million.
Bega Valley Shire Council manages over $1.7 billion in assets that allow visitors and community alike to live, work and play in this beautiful part of the world.
Statistics ... Bega Valley
POPULATION
|
|
Bega Valley |
NSW |
| Population 2021 | 35,942 | |
| Estimated population 2036 | 40,709 | |
| Forecast population increase by 2036 | 13.79% | |
| Median age | 52 | 39 |
| Persons per hectare | 0.06 | 0.1 |
| Source: ABS Census 2021, forecast.id | ||
FORECAST POPULATION COHORTS %
|
|
Bega Valley
|
Bega Valley
|
| Age 0 to 17 | 18.84 | 19.1 |
| Age 18 to 34 | 14.0 | 14.8 |
| Age 35 to 59 | 29.4 | 28.3 |
| Age 60 plus | 37.8 | 37.8 |
| Source: forecast.id | ||
HOW WE LIVE %
|
|
Bega Valley
|
NSW
|
| Couples with dependents | 19.4 | 30.8 |
| One parent families | 8.7 | 10.6 |
| Couples without dependents | 32.9 | 25 |
| Live alone | 28.5 | 23.7 |
| Group household | 2.4 | 3.7 |
| Other households | 4.3 | 4.0 |
| Visitor only households | 3.3 | 1.2 |
| Source: ABS Census 2021 | ||
DIVERSITY %
|
|
Bega Valley
|
NSW
|
| Aboriginal and Torres Strait Islander | 3.9 | 3.4 |
| Overseas born | 12.1 | 29.3 |
| Language at home other than English | 4.6 | 29.5 |
| Source: ABS Census 2021 | ||
HEALTH AND HELPING %
|
|
Bega Valley
|
NSW
|
| Volunteering | 21.9 | 13 |
| Provided assistance to person with disability | 13.5 | 11.9 |
| Need assistance with core activities | 6.3 | 5.8 |
| Source: ABS Census 2021 | ||
TRANSPORT TO WORK %
|
|
Bega Valley
|
NSW
|
| Car | 67.0 | 46.3 |
| Worked at Home | 12.6 | 31.0 |
| Walked | 4.6 | 2.5 |
| Truck | 1.3 | 0.7 |
| Public transport | 0.4 | 4.0 |
| Source: ABS Census 2021 | ||
HOUSING %
Bega Valley
|
NSW
|
|
| Number of dwellings | 18,743 | |
| Average household size | 2.2 | 2.6 |
| Live in separate house (%) | 81.5 | 63.8 |
| Unoccupied dwellings (%) | 15.4 | 8.9 |
| Own home outright (%) | 46.7 | 30.3 |
| Households with a mortgage (%) | 24.5 | 31 |
| Households renting (%) | 20 | 31.3 |
| Source: ABS Census 2021 | ||
INCOME AND EXPENDITURE $
Bega Valley
|
NSW
|
|
| Median weekly household income | 1,200 | 1,829 |
| Median weekly mortgage repayments | 350 | 500 |
| Median weekly rent | 310 | 420 |
| Source: ABS Census 2021 | ||
EDUCATION %
|
|
Bega Valley
|
NSW
|
| Completed university qualification | 18.6 | 27.8 |
| Completed advanced diploma or diploma | 9.0 | 9.3 |
| Completed a trade qualification (certificate) | 21.1 | 15.0 |
| Completed year 12 | 43.1 | 56.9 |
| Attending university | 1.6 | 4.7 |
| Attending TAFE | 2.0 | 1.4 |
| Source: ABS Census 2021 | ||
MAJOR EMPLOYING SECTORS (persons employed)
| Health Care and Social Assistance | 2,259 |
| Retail Trade | 1,539 |
| Accommodation and Food Services | 1,438 |
| Edcation and Training | 1,139 |
| Construction | 1,060 |
| Manufacturing | 964 |
| Agriculture, Forestry and Fishing | 894 |
| Source: ABS Census 2021 | |
TOP 5 INDUSTRIES ($m output)
| Construction | 477 |
| Manufacturing | 461.2 |
| Agriculture, Forestry and Fishing | 367.1 |
| Health Care and Social Assistance | 268.7 |
| Accommodation and Food Services | 164.6 |
| Source:NIER 2021/2022 | |
WORKFORCE
| Population | * 35,942 |
| Total Employment | ** 15,786 |
| Unemployment Rate | *** 3.8% |
| Participation Rate | * 77.2% |
| Workforce in Full Time Work | * Bega Valley 49.0% * NSW 55.2% |
| Workforce in Part Time Work | * Bega Valley 40.2% * NSW 29.7% |
|
Data sources: *ABS 2021 Census, **NIEIR 2021/22, |
|
OTHER ECONOMIC STATS
| Gross Regional Product | * $1.78 billion |
| Value of Exports | * $767.1 million |
| Local Businesses | ** 3,153 |
| Source: * NIEIR 2021/22, ** ABS 2021 | |
AGRICULTURAL PRODUCTION
| Milk | 61.2% $61.291m |
| Livestock | 31.1% $28.658m |
| Crops | 6.4% $5.889m |
| Source: ABS 2021 | |
TOURISM
|
Note: Published performance in this period was impacted by COVID-19 restrictions. |
|
| Total Visitor Spend | $484m |
| Number of visitors annually | 1.02m |
|
*Year Ending December 2022 - Tourism Research Australia (includes international visitor nights, domestic visitor nights and domestic daytrips) |
|
© Bega Valley Shire Council 2024
Our council websites
Contact Us
- 02 6499 2222
- council@begavalley.nsw.gov.au
-
Zingel Place
PO Box 492
Bega NSW 2550 -
Monday to Friday 9.00AM to 4.30PM
Administration building Zingel Place Bega
Australia -
ABN: 26 987 935 332
Was this helpful?